Western PA home prices and inventory ended 2025 with modest price growth, more listings than a year ago, and mortgage rates easing into the low 6% range, setting up 2026 as a more balanced—though still competitive—market for both buyers and sellers. Buyers in areas like North Huntingdon, Irwin, and Westmoreland County should expect stable-to-slowly rising prices and slightly better selection, while sellers can still succeed if they price strategically and prepare homes well.
2025 Market Recap: Pennsylvania and Western PA
Home prices
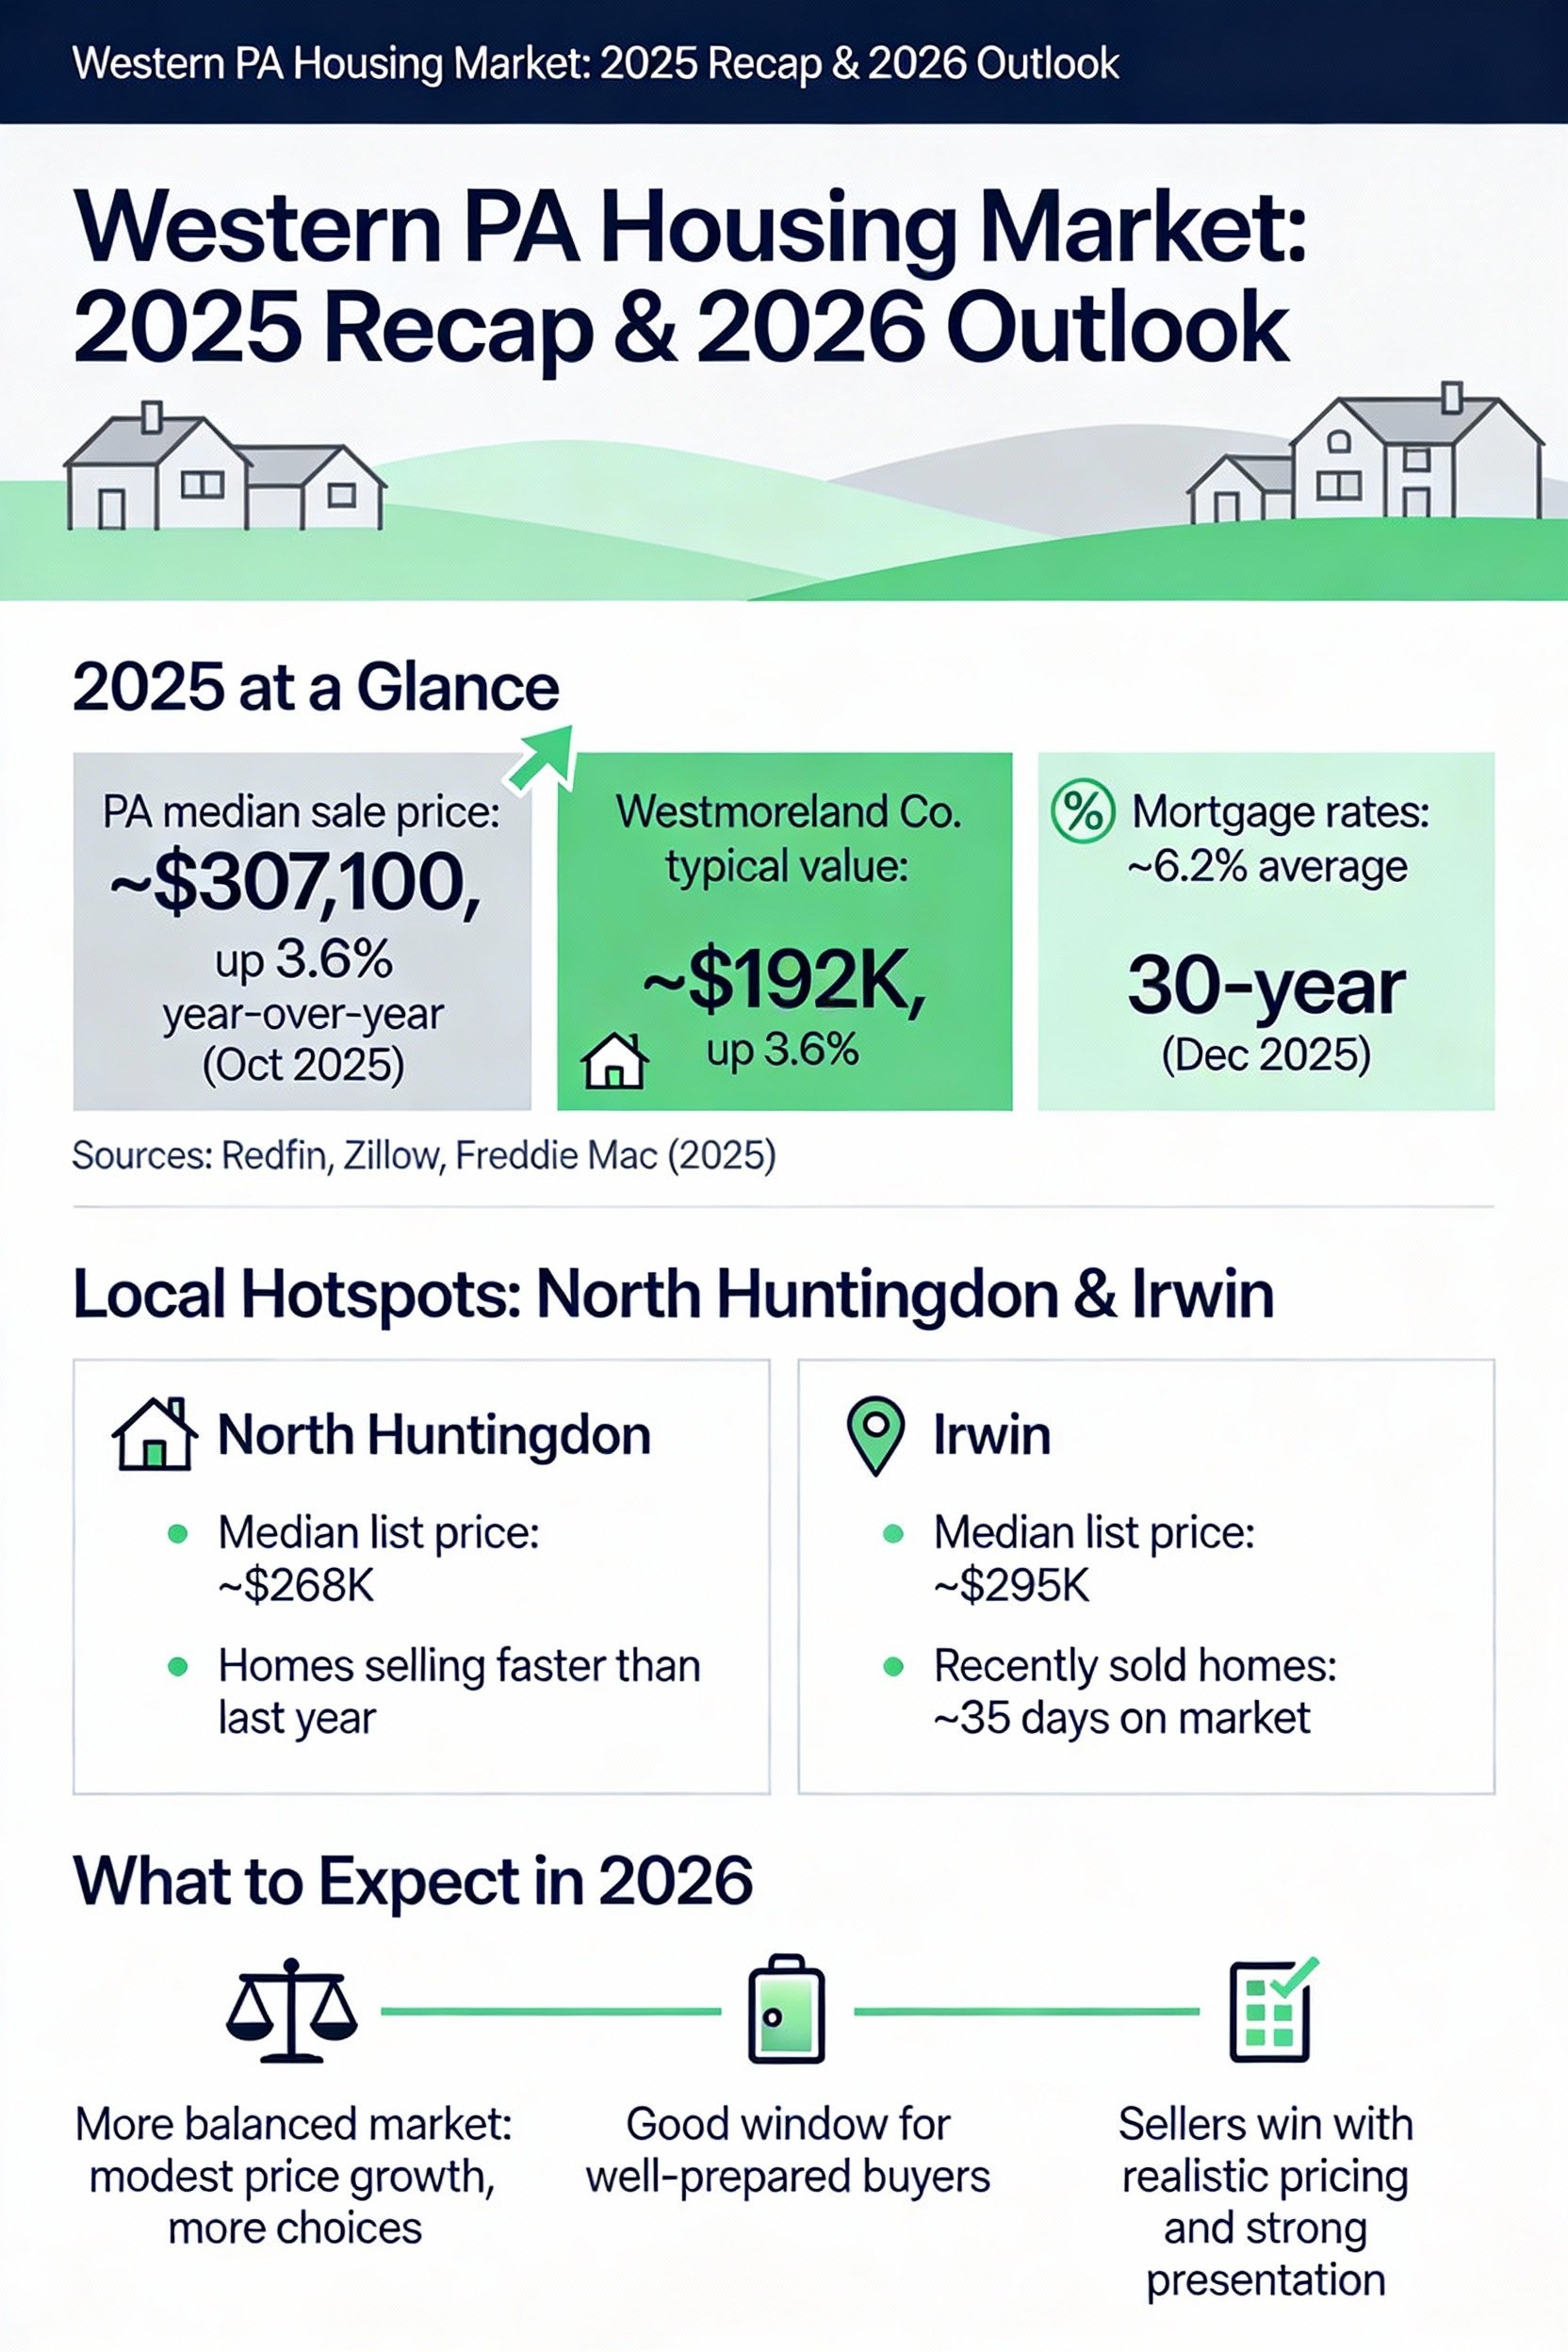
In Pennsylvania overall, the median home sale price in October 2025 was about $307,100, up 3.6% year-over-year, indicating steady but not runaway appreciation (Redfin, October 2025). Zillow’s statewide data shows a typical home value of roughly $278,000 as of late November 2025, up about 3.1% over the prior 12 months (Zillow, data through October 31, 2025).
In Westmoreland County, Zillow reports a typical home value around $191,700, up 3.6% over the past year, with homes going pending in about 28 days (Zillow, data through February 28, 2025). Local submarkets vary, but most communities in the county are seeing low-single-digit annual price gains rather than declines.
These figures confirm that Western PA remains more affordable than many U.S. markets, while still delivering positive price growth for owners. For context, nearby Latrobe shows typical values near $200,000 with roughly flat prices year-over-year, underscoring the region’s moderate and stable price environment (Zillow, data through November 30, 2025).
Inventory and sales activity
Across Pennsylvania, home sales in October 2025 were up 2.9% year-over-year, with 11,625 homes sold compared with 11,293 a year earlier (Redfin, October 2025). A separate report from the Pennsylvania Association of Realtors shows statewide listings around 43,600 in October 2025—about 50% higher than in January 2025—signaling a clear improvement in buyer options even as prices hold near $300,000 (PAR/PR Newswire, October 2025). Pennsylvania’s median days on market stood near 50 days in September 2025, slightly higher than in mid-2025 but still consistent with a market where homes are selling, just not at the frenzied pace of the pandemic years (FRED median days on market, September 2025).
In North Huntingdon specifically, recent trend data shows homes selling after about 117 days on market in late 2025, compared with 166 days a year earlier, highlighting a meaningful acceleration in the local market (Movoto, November 2025). That improvement in time-to-sell, paired with rising inventory statewide, suggests Western PA buyers have more to choose from but still need to move decisively on well-priced homes.
Spotlight on North Huntingdon and Irwin
North Huntingdon
Realtor.com’s August 2025 snapshot shows the median listing home price in North Huntingdon at about $267,500, flat year-over-year. Recently sold data indicates a median sold price around $259,160 across 161 recent sales, reinforcing that closed-sale prices sit in the mid-$200,000s for many homes (Realtor.com, 161 recently sold properties, 2025). Price per square foot was reported around $186, and buyers saw a range of active listings from roughly $10,000 to the mid-$800,000s, giving a wide spread of options (Realtor.com, August 2025).
Irwin (15642 and surrounding)
For the Irwin-area 15642 ZIP code, Realtor.com reports a median listing home price of about $295,000 in August 2025, up 9.3% year-over-year, with a median sold price around $275,000 (Realtor.com, August 2025). By September 2025, the broader Irwin market showed a median listing price around $288,000, with median price per square foot near the high $100s (Realtor.com, September 2025).
Zillow places Irwin’s typical home value at approximately $256,260, up 2.4% over the prior year, with homes going pending in about 16 days—significantly faster than many nearby markets (Zillow, data through October 31, 2025). Realtor.com notes that recently sold homes in Irwin carried a median listing price around $284,900 and spent about 35 days on market before sale (Realtor.com, 248 properties sold, 2025).
Key Drivers in 2025
Mortgage rates
By mid-December 2025, the average 30‑year fixed-rate mortgage was about 6.22%, down from a year-to-date average of 6.62%, reflecting some easing from 2023–2024 highs (Freddie Mac Primary Mortgage Market Survey, week of December 11, 2025). The 15‑year fixed-rate averaged 5.54% at the same time, also lower than its year-ago level, providing slightly better financing options for buyers willing to take on shorter terms (Freddie Mac, December 11, 2025).
Industry commentary suggests that mortgage rates may need to fall closer to roughly 5.75% to fully “unlock” more pent-up seller and buyer activity, but the shift from the mid‑7% range earlier in the cycle down into the low‑6% range is already helping affordability on the margin (lender/agent survey summary, October 2025). For Western PA buyers, this means payments are still higher than pre‑2020 norms but more manageable than the peak rate environment of 2023–2024.
Inventory and delisting trends
Nationally, Realtor.com’s July 2025 report highlighted that the inventory of homes for sale rose 24.8% year-over-year, representing the 21st straight month of inventory growth and a new post‑pandemic high, even though active listings remained below pre‑2020 levels (Realtor.com, July 2025 Trends Report). Pennsylvania-specific data shows a similar direction, with July 2025 inventory up 9.5% year-over-year to about 42,270 homes—reaching a three‑year high and signaling real progress away from extreme low-inventory conditions (Pennsylvania Association of Realtors, July 2025 housing report).
At the same time, delistings have surged: homes removed from the market were up about 45.5% year-to-date through October 2025 compared with the same period in 2024, the highest rate since Realtor.com began tracking in 2022 (Realtor.com data summarized by Investopedia, December 10, 2025). In October 2025 specifically, roughly 27 homes were delisted for every 100 new listings, reflecting sellers who prefer pulling their home rather than cutting prices in a market where some buyers remain rate-sensitive (Realtor.com/Investopedia analysis, October–December 2025).
For Western PA, these trends translate into more overall choice than in 2022–2023, but still a backdrop where desirable, well-priced homes in places like North Huntingdon and Irwin attract serious interest and can move quickly.
2026 Predictions: What to Expect
Price trends
Most statewide forecasts point toward continued, moderate price appreciation in 2026 rather than sharp swings, with Pennsylvania home values expected to rise slowly alongside improvements in inventory and slight relief on mortgage rates. Zillow’s broader Pennsylvania outlook, combined with recent FHFA price index data through Q3 2025, suggests prices are more likely to grow in the low single digits than to drop meaningfully, especially in stable markets like Western PA (Zillow statewide trends, data through October 2025; FHFA House Price Index through Q3 2025). See the value of your current home with our home valuation tool.
Local submarkets such as Westmoreland County, Irwin, and North Huntingdon, which have not seen extreme speculative run-ups, are well-positioned for this kind of “slow and steady” environment. Barring an unexpected economic shock, owners in 2026 should expect broadly stable or mildly rising values, with sharper movements only in hyper-local segments (e.g., fixer-upper inventory or highly updated move‑in‑ready homes).
Inventory outlook
With statewide active listings already at multi‑year highs in mid‑to‑late 2025, incremental inventory gains in 2026 are likely, though the pace may slow as more sidelined sellers finally list and some delisted homes re‑enter the market at adjusted prices (PAR inventory report, July and October 2025). If new listings continue to outpace sales modestly, buyers in North Huntingdon, Irwin, and greater Westmoreland County should see a bit more breathing room and a broader set of choices, especially in the mid‑price segments.
However, elevated delisting rates show that some sellers will continue to test the market and pull back if they cannot achieve target prices, which could keep truly “A‑tier” listings competitive. For both sides, this favors realistic pricing and strategic preparation over assuming either a pure seller’s or pure buyer’s market.
Buyer and seller behavior
If mortgage rates hold near or drift slightly below the low‑6% range in 2026, more “rate‑locked” owners from prior years may finally be willing to trade up or downsize, adding needed inventory. Buyers who paused their search in 2023–2024 due to affordability concerns are also likely to re‑enter, leading to steady—but not overheated—demand.
Expect continued segmentation: turnkey homes in popular school zones and commuter-friendly neighborhoods should draw multiple offers, while properties needing work or priced too aggressively may sit longer or be delisted. Local agents who can interpret micro‑trends block by block will be especially valuable as buyers and sellers navigate this more nuanced phase of the cycle.
What This Means for You
For sellers
Sellers in 2026 can benefit from a larger pool of active buyers than in 2023–2024, combined with price levels that remain above pre‑pandemic baselines. To stand out amid rising inventory and higher delisting rates, pricing close to recent comparable sales in your neighborhood and investing in presentation (staging, professional photography, and minor repairs) will be critical.
In markets like North Huntingdon and Irwin, where median listing and sold prices hover in the mid‑$200,000s to high‑$200,000s, aligning your list price with recent closed data—rather than 2022 peak expectations—can significantly shorten time on market. Partnering with a local expert who watches these metrics weekly helps you adjust quickly if buyer traffic or showing feedback suggests a shift is needed.
For buyers
For buyers, 2026 offers a more balanced landscape than the ultra‑tight conditions of prior years, with more listings to choose from and mortgage rates that, while not “cheap,” are more manageable than recent peaks. In North Huntingdon and Irwin, where typical values range from the mid‑$200,000s to just under $300,000, having a strong pre‑approval and clear budget lets you move quickly when the right property appears.
Because delistings are elevated, some homes may re‑enter the market at improved prices or with refreshed marketing, giving patient buyers second chances on properties that did not sell initially. Balancing patience with readiness—watching days on market, price changes, and recent solds—will help you negotiate confidently without overpaying.
Updated FAQ
Q. Are home prices still rising in Western PA?
Yes. Pennsylvania’s median sale price rose 3.6% year-over-year in October 2025 to about $307,100, and Westmoreland County’s typical home value rose around 3.6% over the past year, indicating modest but continued growth (Redfin, October 2025; Zillow, data through February 28, 2025). Local submarkets such as Irwin and Latrobe show low-single-digit annual gains, reflecting a generally stable upward trend rather than a decline (Zillow and Realtor.com, 2025 snapshots).
Q. How long are homes staying on the market locally?
In North Huntingdon, recent data shows homes selling after about 117 days on market, down from 166 days a year ago, signaling faster movement even as inventory rises (Movoto, November 2025). In Irwin, recently sold properties spent about 35 days on market, underscoring the relative strength of demand for well-priced homes there (Realtor.com, 248 properties sold in 2025).
Q. Should I wait to buy until rates fall?
The average 30‑year mortgage rate was about 6.22% as of December 11, 2025—below the 2025 year‑to‑date average of 6.62% but still higher than pre‑2020 norms (Freddie Mac PMMS, December 2025). Waiting could bring modest rate improvements, but you may also face more competition as inventory stabilizes and sidelined buyers return; getting pre‑approved now and watching both rates and local listings lets you act quickly if the right combination appears.
Q. Will 2026 be better for sellers or buyers?
Rising inventory and slightly lower rates tilt conditions toward a more balanced market, giving buyers more choice while allowing sellers to retain much of the price appreciation gained over recent years (Realtor.com July 2025 inventory report; PAR inventory data). Both sides can do well in 2026: sellers who price realistically and prepare homes carefully, and buyers who stay informed about recent comps and move decisively on well‑matched properties.
About Adam Slivka
If you are considering buying or selling in North Huntingdon, Irwin, or anywhere in Western Pennsylvania, connect with Western PA real estate agent Adam Slivka for hyper-local guidance grounded in the latest pricing, inventory, and days‑on‑market data. Adam can help interpret market shifts street by street and tailor strategies to your timing, budget, and goals.
Contact Adam Slivka today to request a free, customized market report for your neighborhood, schedule a professional home valuation, or start your home search with up‑to‑the‑minute listing alerts. With current data on pricing trends, competition, and financing conditions at your fingertips, you can move into 2026 with a clear game plan for your next move.
Sources and Citations
Redfin – Pennsylvania Housing Market: House Prices & Trends
Used for statewide Pennsylvania median sale price, year-over-year change, and homes sold in October 2025.
Date: Page updated December 3, 2025; data through October 2025.
URL: https://www.redfin.com/state/Pennsylvania/housing-market
Zillow – Pennsylvania Housing Market: 2025 Home Prices & Trends
Used for statewide typical home value, annual appreciation, and broader PA price trends.
Date: Data through October 31, 2025 (page updated November 29, 2025).
URL: https://www.zillow.com/home-values/47/pa/
Zillow – Westmoreland County, PA Housing Market
Used for typical home value, year-over-year price change, and days to pending in Westmoreland County.
Date: Data through February 28, 2025 (page updated April 2, 2025).
URL: https://www.zillow.com/home-values/3200/westmoreland-county-pa/
Zillow – Latrobe, PA Housing Market: 2025 Home Prices & Trends
Used to illustrate nearby submarket pricing and stability as context for Westmoreland County.
Date: Data through November 30, 2025 (page updated November 22, 2025).
URL: https://www.zillow.com/home-values/32437/latrobe-pa/
Zillow – Irwin, PA Housing Market: 2025 Home Prices & Trends
Used for Irwin typical home value, year-over-year change, and days to pending.
Date: Data through October 31, 2025 (page updated November 18, 2025).
URL: https://www.zillow.com/home-values/32168/irwin-pa/
Realtor.com – North Huntingdon, PA 2025 Housing Market
Used for North Huntingdon median listing price, median sold price, price per square foot, and price range.
Date: Market overview snapshot as of September 19, 2025.
URL: https://www.realtor.com/realestateandhomes-search/North-Huntingdon_PA/overview
Realtor.com – 15642, PA 2025 Housing Market (Irwin)
Used for Irwin/15642 median listing price, year-over-year change, and median sold price.
Date: Market overview snapshot as of September 19, 2025.
URL: https://www.realtor.com/realestateandhomes-search/15642/overview
Realtor.com – Irwin, PA 2025 Housing Market
Used for Irwin median listing price and general market context separate from ZIP-level data.
Date: 2025 market overview.
URL: https://www.realtor.com/realestateandhomes-search/Irwin_PA/overview
Realtor.com – Recently Sold Homes in North Huntingdon, PA
Used for median sold price and number of recently sold properties.
Date: 2025, based on 161 recent sales.
URL: https://www.realtor.com/realestateandhomes-search/North-Huntingdon_PA/show-recently-sold
Realtor.com – Recently Sold Homes in Irwin, PA
Used for median list price at sale and days on market for recently sold Irwin homes.
Date: 2025, based on 248 properties sold.
URL: https://www.realtor.com/realestateandhomes-search/Irwin_PA/show-recently-sold
Realtor.com – Listing Example: 11665 Wilshire Dr, North Huntingdon, PA 15642
Used as an example of late‑2025 listing prices and range in North Huntingdon.
Date: Listing active as of November 8, 2025.
URL: https://www.realtor.com/realestateandhomes-detail/11665-Wilshire-Dr_North-Huntingdon_PA_15642_M34462-82716
Realtor.com – Listing Example: 2331 Guffey Rd, North Huntingdon, PA 15642
Used as an example of late‑2025 listing prices and range in North Huntingdon.
Date: Listing active as of October 14, 2025.
URL: https://www.realtor.com/realestateandhomes-detail/2331-Guffey-Rd_North-Huntingdon_PA_15642_M35294-97566
Movoto – North Huntingdon, PA Market Trends
Used for North Huntingdon days on market trend (e.g., decrease from 166 to 117 days).
Date: Market trends data accessed late 2025.
URL: https://www.movoto.com/north-huntingdon-pa/market-trends/
Homes.com – North Huntingdon, PA City Guide
Used as a general local-market context reference (neighborhood and lifestyle framing).
Date: City guide updated October 24, 2025.
URL: https://www.homes.com/local-guide/north-huntingdon-pa/
Pennsylvania Association of Realtors® / PR Newswire – “Pennsylvania Home Sales Climb 4.5% in Latest Monthly Report”
Used to support statewide inventory and listing level changes and multi‑year high context.
Date: News release November 19–20, 2025 (reporting October 2025 data).
URL: https://www.prnewswire.com/news-releases/pennsylvania-home-sales-climb-4-5-in-latest-monthly-report-302621838.html
LVB – “Pennsylvania sees uptick in housing inventory”
Used for Pennsylvania July 2025 inventory increase (9.5% YoY to ~42,270 homes) and 3‑year high commentary.
Date: August 21, 2025.
URL: https://lvb.com/pennsylvania-sees-uptick-in-housing-inventory/
Realtor.com – July 2025 Monthly Housing Market Trends Report
Used for national inventory growth (24.8% YoY, 21st consecutive month of gains, post‑pandemic high).
Date: July 30, 2025 (covering July 2025 data).
URL: https://www.realtor.com/research/July-2025-data/
Freddie Mac – Primary Mortgage Market Survey® (PMMS): Mortgage Rates
Used for average 30‑year and 15‑year fixed mortgage rates (e.g., 6.22% and 5.54% for the week of December 11, 2025) and year‑to‑date comparison.
Date: Weekly survey published November 11, 2025 and updated through December 11, 2025.
URL: https://www.freddiemac.com/pmms
The Mortgage Reports – Mortgage Rate History | Chart & Trends Over Time 2025
Used for context on the broader rate trend and prior peaks relative to late‑2025 levels.
Date: December 4, 2025.
URL: https://themortgagereports.com/61853/30-year-mortgage-rates-chart
Investopedia – “Delistings Jump 45% as Sellers Pull Homes Rather Than Cut Prices”
Used for national delisting data (45.5% increase year‑to‑date through October 2025 and 27 delistings per 100 new listings).
Date: December 10, 2025.
URL: https://www.investopedia.com/homes-for-sale-delisted-jump-11863935
AOL / Fox10 / Related Coverage – “Home delistings surge as sellers struggle to get their price”
Used to reinforce the narrative around elevated delistings and seller reluctance to cut prices.
Date: December 7–8, 2025.
URL: https://www.aol.com/finance/home-delistings-surge-sellers-struggle-213314973.html
FRED – Housing Inventory: Active Listing Count in Pennsylvania (ACTLISCOUPA)
Used for October 2025 active listing count and trend direction in Pennsylvania.
Date: Series updated October 29, 2025.
URL: https://fred.stlouisfed.org/series/ACTLISCOUPA
FRED – Housing Inventory: Median Days on Market in Pennsylvania (MEDDAYONMARPA)
Used for September 2025 median days on market statewide (around 50 days) and general trend.
Date: Series updated October 1, 2025.
URL: https://fred.stlouisfed.org/series/MEDDAYONMARPA
FRED – All‑Transactions House Price Index for Pennsylvania (PASTHPI)
Used to support statements about Pennsylvania’s long‑term home price direction and low‑single‑digit trend.
Date: Series updated November 24, 2025 (through Q3 2025).
URL: https://fred.stlouisfed.org/series/PASTHPI
Norada Real Estate – Pennsylvania Housing Market: Trends and Forecast 2025–2026
Used for statewide forward-looking commentary and expectations for modest price growth into 2026.
Date: October 24, 2024 (still cited in 2025–2026 outlooks).
URL: https://www.noradarealestate.com/blog/pennsylvania-housing-market/
NHRE Partners – Pennsylvania Housing Market Trends in 2025
Used for additional narrative context on Pennsylvania market conditions and regional differences.
Date: October 13, 2025.
URL: https://nhrepartners.com/pennsylvania-housing-market-trends-in-2025/
ATTOM – Pennsylvania Real Estate & Property Data
Used for background reference on statewide real estate metrics and context.
Date: Data page updated April 21, 2025.
URL: https://propertynavigator.attomdata.com/data/us-real-estate/pa/